Data / Intelligence
Social listening web platform
Social listening web platform (social networks, mainly TikTok), with a client view and an admin panel.
- 1+ year
- In operation

PXL DATA
We design modern data architectures: ingestion, dimensional modelling, a data warehouse, governed transformations, self-service analytics and metrics the business team actually understands.
What's included
We define the architecture, sources, data model, ingestion frequency and a governance plan aligned to the business.
Pipelines with Airbyte, Fivetran, dbt or custom development depending on sources and volume. Batch and streaming jobs.
Snowflake, BigQuery, Redshift or Databricks, depending on the query pattern, costs and the existing stack.
Star schemas, certified metrics and a semantic layer so business and data speak the same language.
Business logic that is versioned, tested and documented. No SQL hidden in Looker or in Excel macros.
Looker, Metabase, Tableau, Power BI depending on the maturity of the team. Dashboards that refresh automatically and that the end user actually opens.
Automated quality tests, lineage, a data catalogue, ownership and access by role. Compliance from the modelling stage.
Integration of analytics inside digital products (B2B SaaS dashboards, customer portals) and the construction of custom data products.
We turn scattered manuals, processes and documents into organized, up-to-date knowledge with a clear owner, ready for AI to answer accurately. Connecting it to agents is covered by PXL Intelligence.
Who it's for
We'll help you decide quickly. If we are not the right match, we point you to who is.
Problem
Many companies think their data problem is a tooling problem, when it is almost always modelling and governance. They buy Tableau or Looker, connect it to a dirty database and produce 200 dashboards nobody believes. The real problem is that there is no single source of truth about what 'revenue', 'active customer' or 'churn' means.
Different metrics between departments because everyone uses their own query
Out-of-date reports with nobody noticing
Fragile ETLs that break every time a source system changes
Weekly reports made by hand that consume days of the team's time
An inability to answer new questions without asking IT for 2 weeks
Access to sensitive data with no control and no audit trail
Outcomes
Well-architected data makes the business team self-sufficient. Decisions that took weeks are taken in minutes. Metrics are consistent between departments. Analytics stops being a reactive service department and becomes a strategic capability.
A single source of truth agreed between business, product and finance
Operational decisions in minutes, not days
A business team able to answer its own questions
Embedded analytics in the product that is monetised or reduces churn
Regulatory compliance with complete lineage and audit trail
Trustworthy data underpinning real AI, automation and forecasting
Process
An inventory of sources, priority use cases, definition of certified metrics and the target architecture.
Building ingestion pipelines and dimensional models. Automated quality tests.
Definition of a certified semantic layer, construction of core dashboards and self-service for business users.
Training, a data catalogue, an access policy and a process for keeping quality and metrics alive.
New use cases, data products, embedded analytics and continuous support with PXL Dedicated or PXL Flex.
Related case studies
Data / Intelligence
Social listening web platform (social networks, mainly TikTok), with a client view and an admin panel.
Government
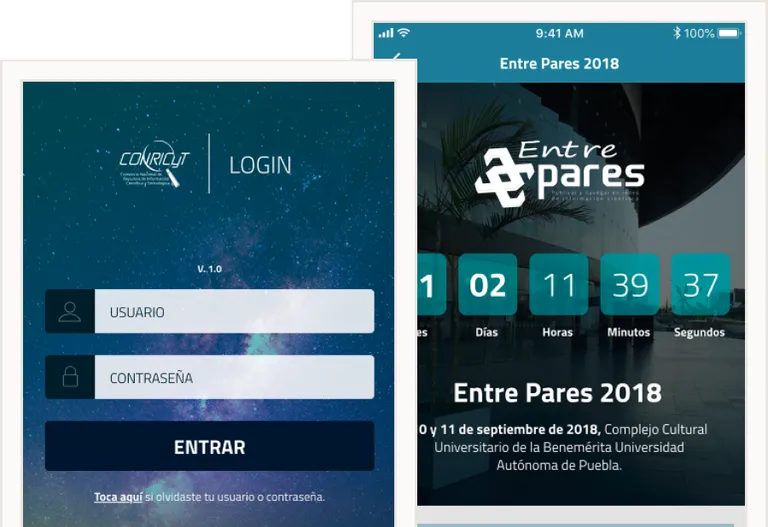
Unified access to academic repositories for 300K+ researchers in Mexico.
B2B SaaS
An AI model for extracting and classifying shopping-centre operational documents (contracts, reports, invoicing). A vector database with semantic search, cross-validation and handover to a human in exceptional cases.
Stack | Tools | Standards
A modern data governance stack. Modelling, transformation and BI on proven cloud platforms.
Frequently asked questions
It depends. BigQuery is excellent if you are already on GCP and your load is analytical with large occasional queries. Snowflake is the most flexible for multi-cloud and mixed workloads. Redshift is still valid if you already have a deep AWS ecosystem. In Discovery we give you a recommendation with costs projected over 12 months.
Because we separate data transformation (dbt, governed and versioned) from visualization (Looker, Tableau, Power BI). That way business logic doesn't stay locked inside a specific dashboard.
Yes, we can build analytics inside your own product, not just internal dashboards for your team.
It depends on the data volume and how many sources are integrated.
Yes, part of the work is helping the business team define metrics they truly understand and use, not just building the data pipeline.
Yes, we apply data governance, role-based access control, and compliance from the data modeling stage itself, not as an afterthought. If your project requires a specific standard, we confirm it from the architecture design stage.
Related services
PXL INTELLIGENCE
PXL Intelligence
AI applied to the business. Automation, agents and language models with verifiable ROI.
PXL CLOUD
PXL Cloud
Cloud architecture. Infrastructure that scales with you, not against you. AWS, GCP and Azure.
PXL SECURITY
PXL Security
Security & pentesting. Hardening, compliance and vulnerability auditing. Because building well is not enough if it is not secure.
A 30-minute call about the state of your data. The initial audit is free.